Last Updated: 17-AUG-2025
| NWS PA | DISCUSSION PA | NWS Radar |
| NWS MD | DISCUSSION MD | NWS Radar | AccuWeather loop |
| 2025 | 2024 | 2023 | 2022 | 2021 | 2020 | 2019 | 2018 | 2017 | 2016 | 2015 | 2014 | 2013 | 2012 | 2011 | 2010 | 2009 | 2008 | 2007 | 2006 | 2005 |
Monthly weather forecast and climate - York, PA
January, like December, in York, Pennsylvania, is another cold winter month, with average temperature varying between 22.6°F and 35.4°F. January is the coldest month, with an average high-temperature of 35.4°F and an average low-temperature of 22.6°F.
February, the last month of the winter, in York, is another cold month, with temperature in the range of an average high of 39.2°F and an average low of 25°F. In York, Pennsylvania, the average high-temperature in February is almost the same as in January - a still wintry 39.2°F.
The first month of the spring, March, is a chilly month in York, Pennsylvania, with temperature in the range of an average high of 48.4°F and an average low of 32.5°F. In York, the average high-temperature rises, from a wintry 39.2°F in February, to a chilly 48.4°F
April is a mild spring month in York, Pennsylvania, with average temperature ranging between max 60.6°F and min 42.4°F. In York, the average high-temperature in April rises, from a frosty 48.4°F in March, to a mild 60.6°F
May, the last month of the spring, in York, is an agreeable month, with temperature in the range of an average high of 70.3°F and an average low of 52.3°F. In York, the average high-temperature in May rises, from a mild 60.6°F in April, to an agreeable 70.3°F
June, the first month of the summer, in York, is a warm month, with average temperature ranging between max 77.9°F and min 59.5°F. In York, the average high-temperature marginally rises, from an agreeable 70.3°F in May, to a warm 77.9°F
July, the same as June, is a moderately hot summer month in York, Pennsylvania, with average temperature fluctuating between 83.3°F and 64.2°F. July is the warmest month, with an average high-temperature of 83.3°F and an average low-temperature of 64.2°F. The average heat index in July is evaluated at a hot 91°F
August, the last month of the summer, in York, is another warm month, with average temperature varying between 62.4°F and 81°F. In August, the average high-temperature is practically the same as in July - a still moderately hot 81°F
September, the first month of the autumn, in York, is still a warm month, with average temperature ranging between min 56.3°F and max 74.7°F. In York, the average high-temperature slightly decreases, from 81°F in August, to a still warm 74.7°F
October, like September, in York, Pennsylvania, is another enjoyable autumn month, with temperature in the range of an average high of 63.1°F and an average low of 46.6°F. In York, the average high-temperature in October decreases, from a warm 74.7°F in September, to a comfortable 63.1°F
November, the last month of the autumn, in York, is another cool month, with temperature in the range of an average high of 50.9°F and an average low of 36°F. In York, Pennsylvania, the average high-temperature decreases, from an enjoyable 63.1°F in October, to a fresh 50.9°F
The first month of the winter, December, is also a wintry month in York, Pennsylvania, with average temperature fluctuating between 29.7°F and 41.9°F. In December, the average high-temperature decreases, from a fresh 50.9°F in November, to a wintry 41.9°F
Monthly weather forecast and climate - Baltimore, MD
January, the same as December, is another cold winter month in Baltimore, Maryland, with average temperature ranging between max 38.5°F and min 27.1°F. With an average high-temperature of 38.5°F and an average low-temperature of 27.1°F, January is the coldest month.
February, the last month of the winter, in Baltimore, is also a wintry month, with average temperature varying between 42.4°F and 29.7°F. In Baltimore, the average high-temperature in February is relatively the same as in January - a still cold 42.4°F
The first month of the spring, March, is a cool month in Baltimore, Maryland, with average temperature ranging between min 36.3°F and max 50.5°F. In March, the average high-temperature slightly increases, from a wintry 42.4°F in February, to a cool 50.5°F
April is a comfortable spring month in Baltimore, Maryland, with temperature in the range of an average low of 46°F and an average high of 63°F. In Baltimore, the average high-temperature rises, from a cool 50.5°F in March, to an enjoyable 63°F
The last month of the spring, May, is a pleasant month in Baltimore, Maryland, with average temperature ranging between min 55.9°F and max 72.1°F. In Baltimore, the average high-temperature in May rises, from a comfortable 63°F in April, to an agreeable 72.1°F
The first month of the summer, June, is a warm month in Baltimore, Maryland, with average temperature fluctuating between 64.2°F and 80.1°F. In Baltimore, the average high-temperature in June slightly increases, from a pleasant 72.1°F in May, to a moderately hot 80.1°F
July, the same as June, is another warm summer month in Baltimore, Maryland, with average temperature varying between 85.3°F and 69.6°F. With an average high-temperature of 85.3°F and an average low-temperature of 69.6°F, July is the warmest month. In July, the average heat index is appraised at a hot 94.1°F
August, the last month of the summer, in Baltimore, is another warm month, with average temperature varying between 67.8°F and 83.5°F. In August, the average high-temperature is essentially the same as in July - a still moderately hot 83.5°F
The first month of the autumn, September, is also a moderately hot month in Baltimore, Maryland, with average temperature varying between 61.3°F and 77°F. In Baltimore, the average high-temperature in September marginally drops, from a warm 83.5°F in August, to a still moderately hot 77°F
October, like September, in Baltimore, Maryland, is another comfortable autumn month, with average temperature fluctuating between 65.3°F and 51.4°F. In October, the average high-temperature decreases, from a moderately hot 77°F in September, to a comfortable 65.3°F
The last month of the autumn, November, is another cool month in Baltimore, Maryland, with average temperature varying between 53.2°F and 40.3°F. In Baltimore, Maryland, the average high-temperature drops, from an enjoyable 65.3°F in October, to a cool 53.2°F
The first month of the winter, December, is still a chilly month in Baltimore, Maryland, with average temperature ranging between max 44.8°F and min 33.4°F. In December, the average high-temperature slightly decreases, from a fresh 53.2°F in November, to a chilly 44.8°F
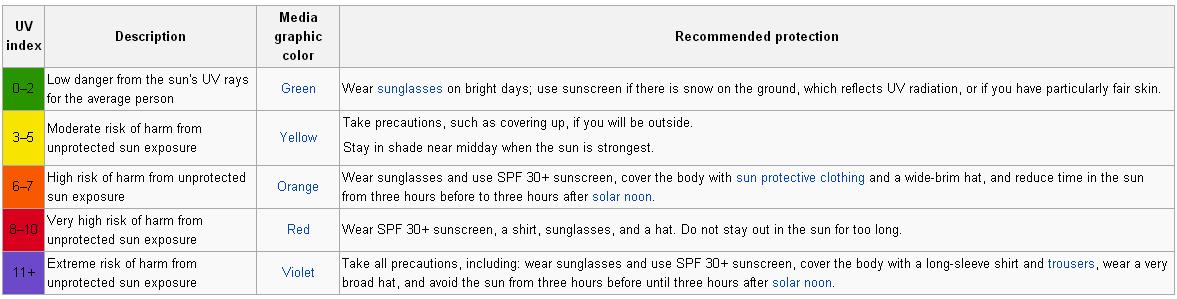
UV Index Scale